05 · Quantitative research · 2026
Testing connection, centrality, and concentration.
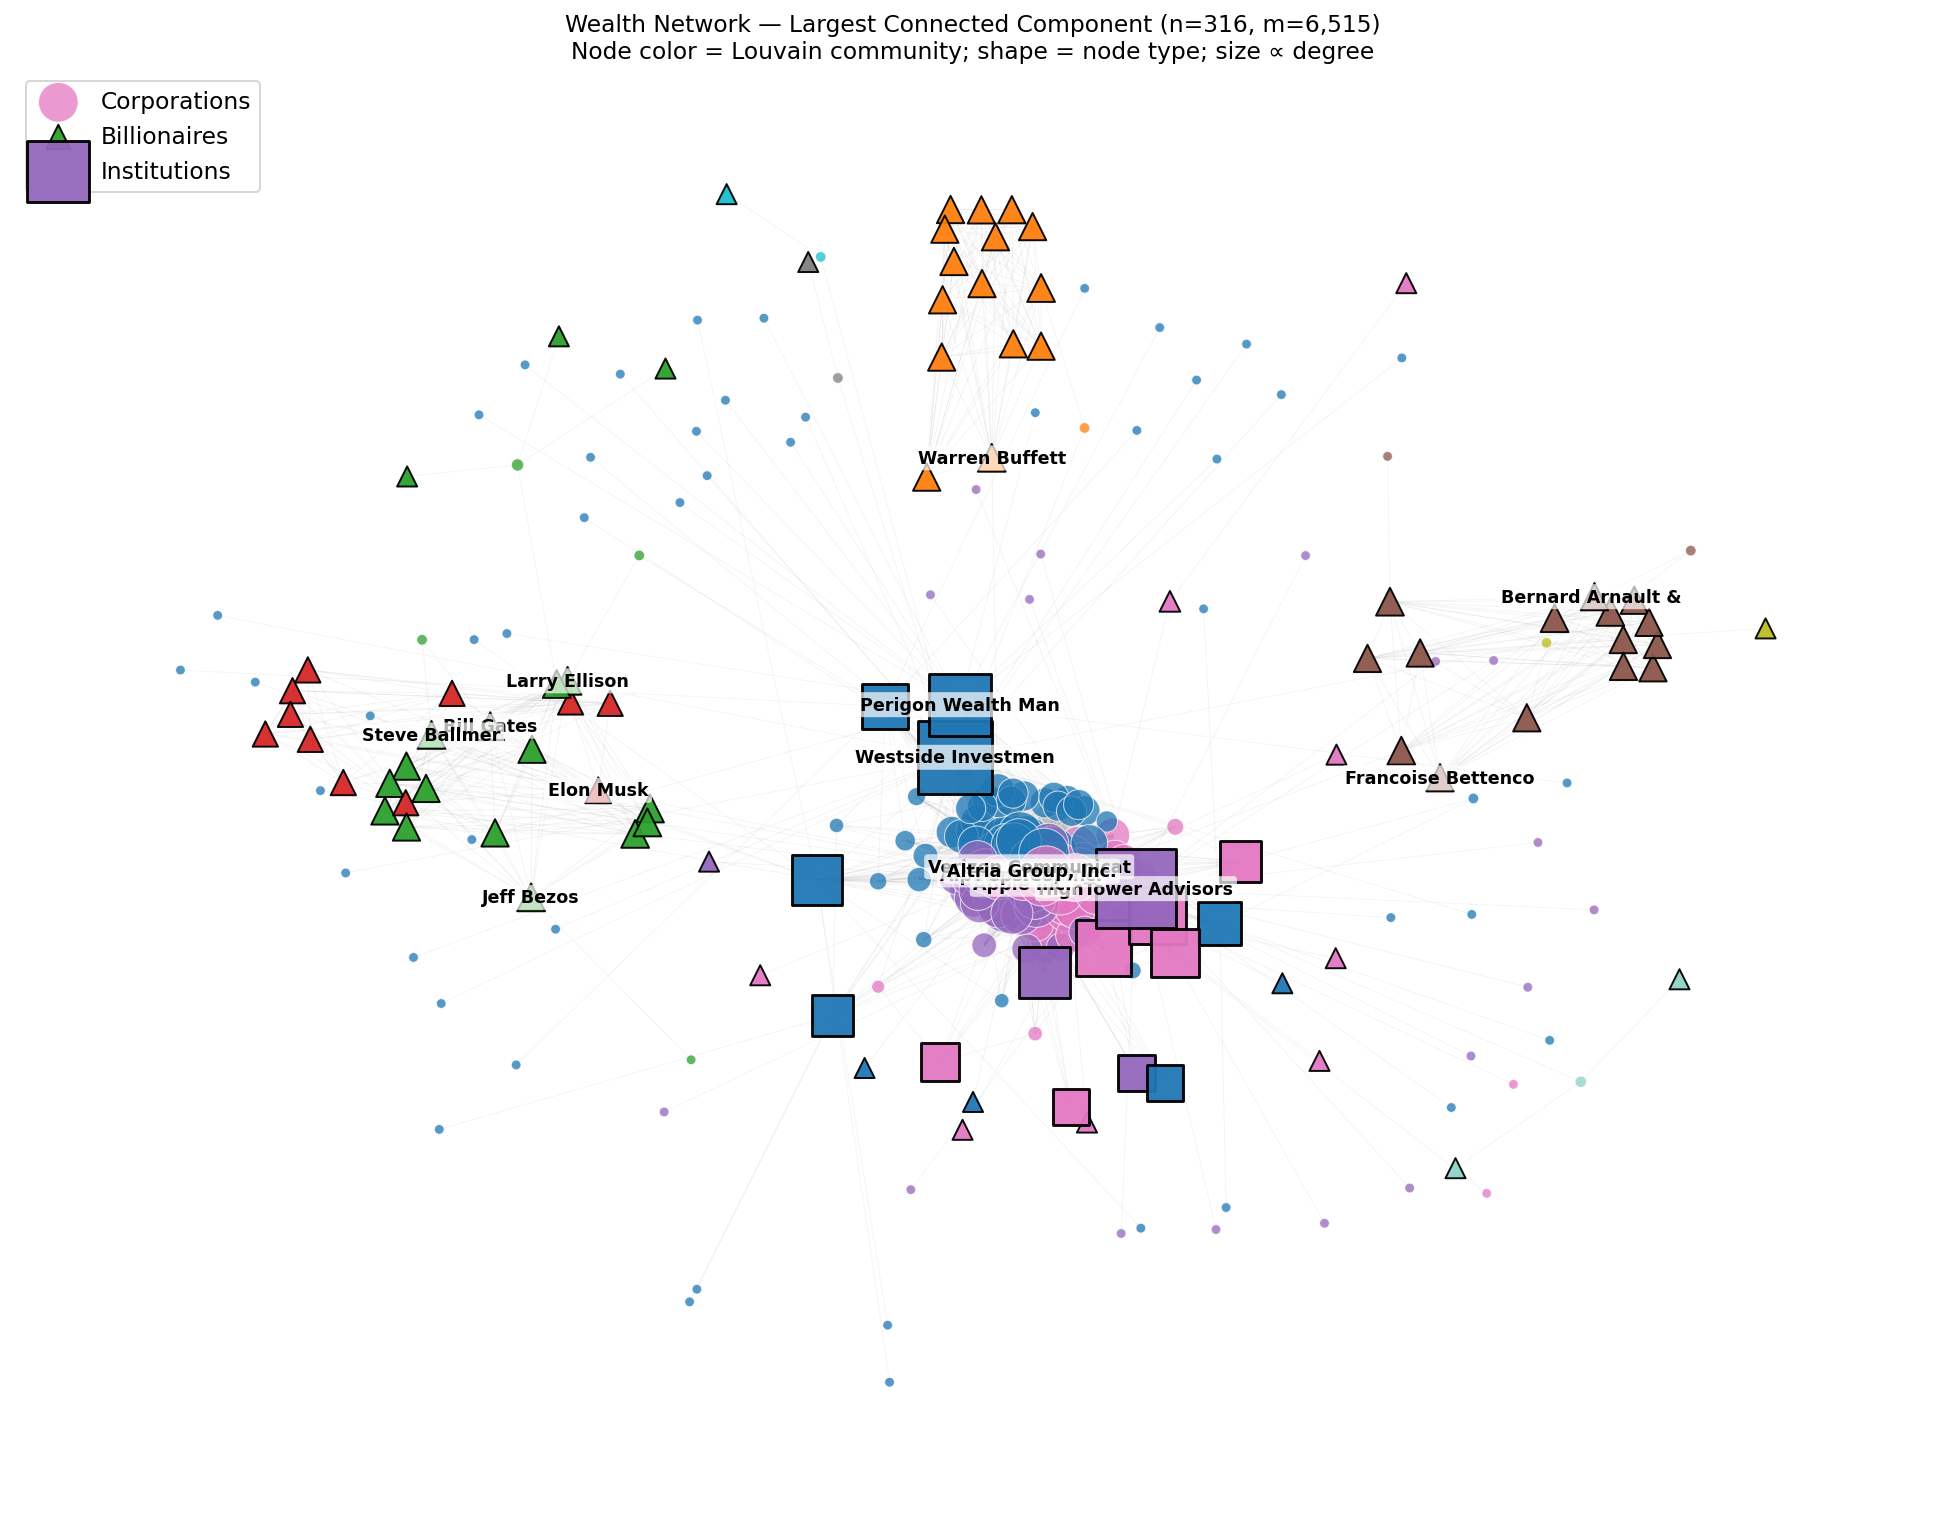
Wealth concentration is often described person by person. I integrated six public datasets into one graph, then tested whether net worth was associated with structural position inside that network.
- Role
- Independent researcher
- Methods
- Regression, centrality, Louvain, power law
- Tools
- Python, NetworkX, public data
- Graph
- 316 nodes · 6,515 edges
Question
Is wealth tied to network position?
Forbes lists, ownership records, institutional filings, and offshore data each describe one slice of wealth. Joining them made structural relationships visible and testable.
Hypothesis: nodes with greater network centrality will have higher net worth. Secondary questions covered degree distribution, community structure, and the friendship paradox.
Method
Build graph, test structure, inspect sensitivity.
- Joined six public sources: Forbes current and historical lists, S&P 500 constituents, SEC 13F filings, ICIJ offshore records, and Crunchbase.
- Standardized entity names and created billionaire, company, institution, and relationship nodes.
- Measured degree, betweenness, eigenvector centrality, and PageRank.
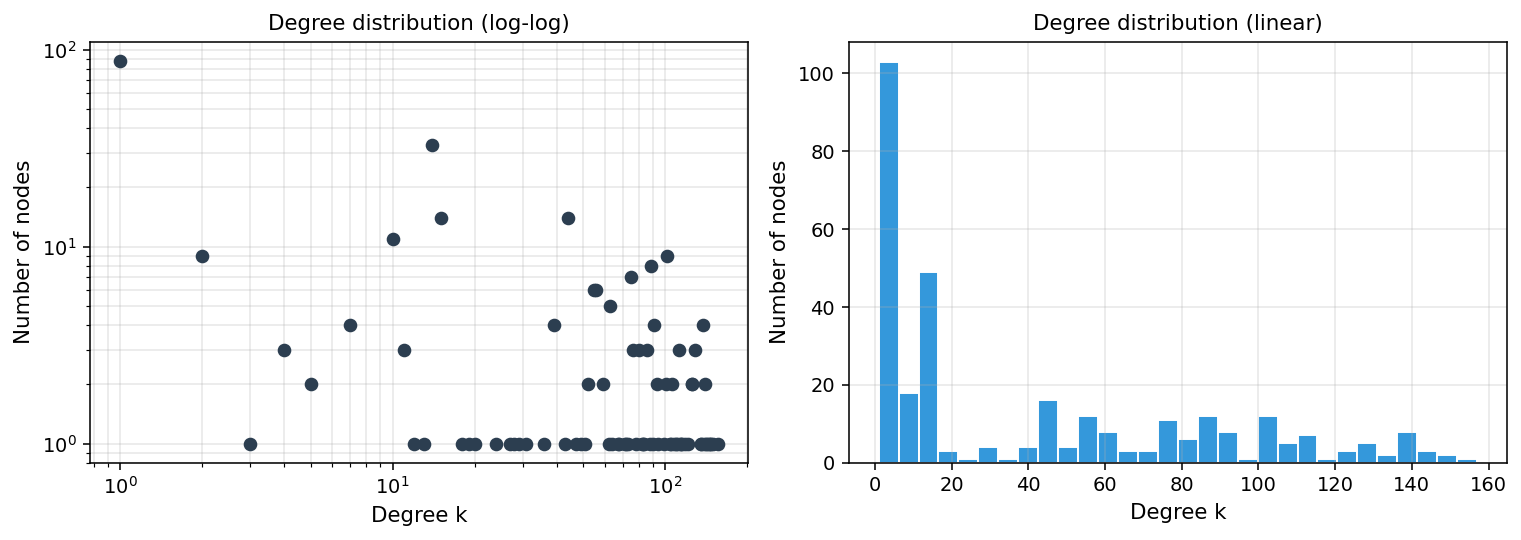
- Compared power-law fit with lognormal and exponential alternatives.
- Ran Spearman association and regression between net worth and network measures.
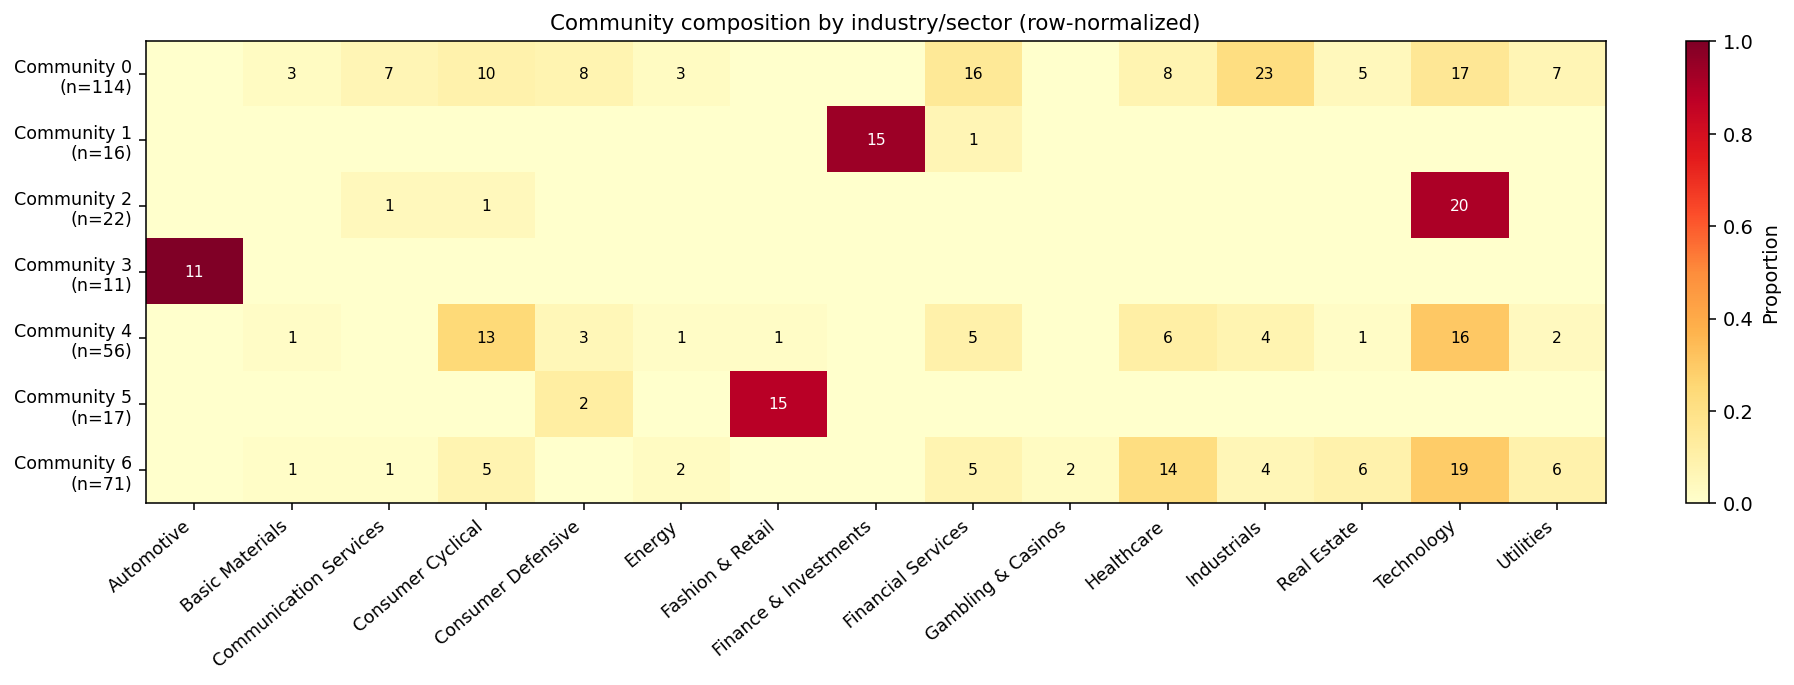
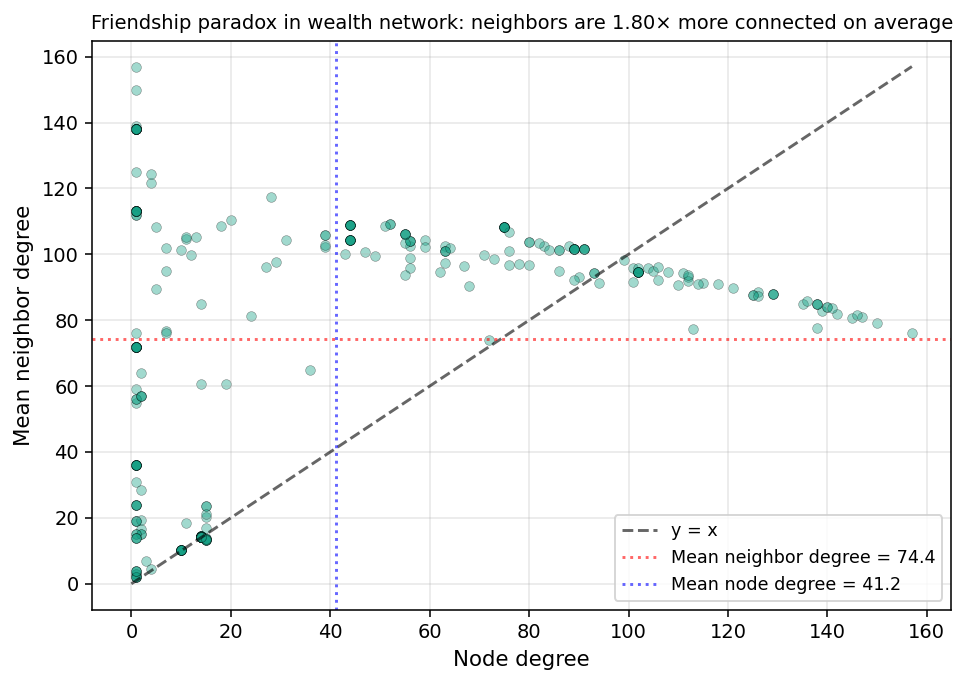
- Detected communities with Louvain and tested neighborhood-degree patterns.
Results
Centrality tracked wealth strongly.
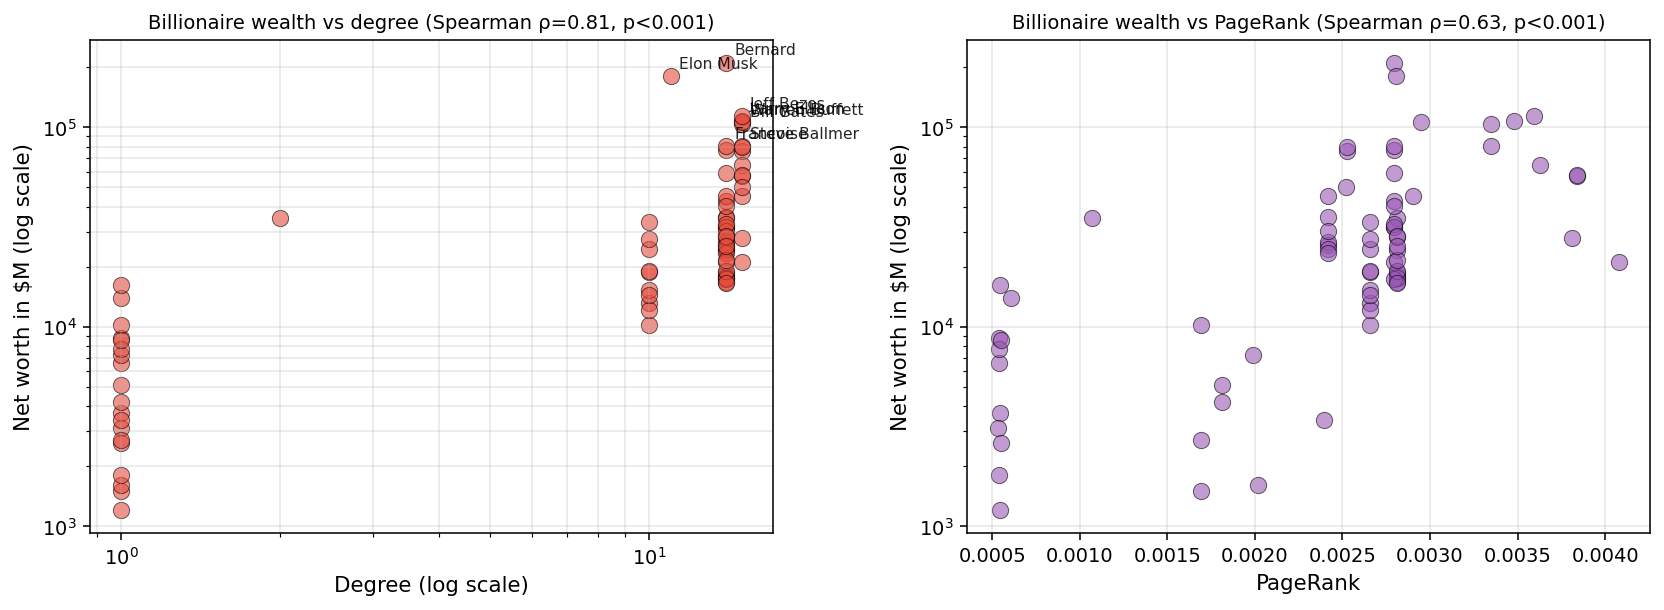
Degree showed a strong monotonic relationship with net worth; other centrality measures were also significant. Community structure suggested dense, interconnected clusters rather than isolated wealth holders.
Artifacts
Show model, not only headline.